Drupal中文社区
原文地址:http://www.codeenigma.com/en/blog/performance-panels
译文地址:http://yplam.com/panels-performance
Panels发布已有一段时间。人们对它的评价不一,这有点像Drupal - 你要不就喜欢它,要不就讨厌它。个人而言,我是panels的粉丝,有很多原因,均有博客文章进行了介绍。而在反对声音中我听到最多的是,Panels会带来性能问题。因为没有看到过一个真正的测试,我决定对Panels与区块进行一次彻底的基准测试,看看会发生什么事情。
方法
在一台13寸Macbook Pro安装上Acquia Dev Desktop环境,安装一个干净的Drupal 7,并且只安装小量标准的核心模块,以及Ctools,Views,Panels。
环境信息:
Drupal version : 7.17
Site URI : http://default
Database driver : mysql
Database hostname : 127.0.0.1
Database username : drupaluser
Database name : acquia_drupal
Database : Connected
Drupal bootstrap : Successful
Drupal user : Anonymous
Default theme : bartik
Administration theme : seven
PHP configuration :
Drush version : 5.4
Drush configuration :
Drupal root : /Users/greg/Sites/acquia-drupal
Site path : sites/default
File directory path : sites/default/files
temp : /tmp
使能模块,并且保证所有都是最新版本:
状态信息:
Name Install Propose Status
ed d
version version
Drupal 7.17 7.17 Up to date
Chaos tools 7.x-1.2 7.x-1.2 Up to date
(ctools)
Entity API (entity) 7.x-1.0 7.x-1.0 Up to date
-rc3 -rc3
Panels (panels) 7.x-3.3 7.x-3.3 Up to date
Pathauto (pathauto) 7.x-1.2 7.x-1.2 Up to date
SQL Server (sqlsrv) 7.x-1.2 7.x-1.2 Up to date
Token (token) 7.x-1.4 7.x-1.4 Up to date
Views (views) 7.x-3.5 7.x-3.5 Up to date
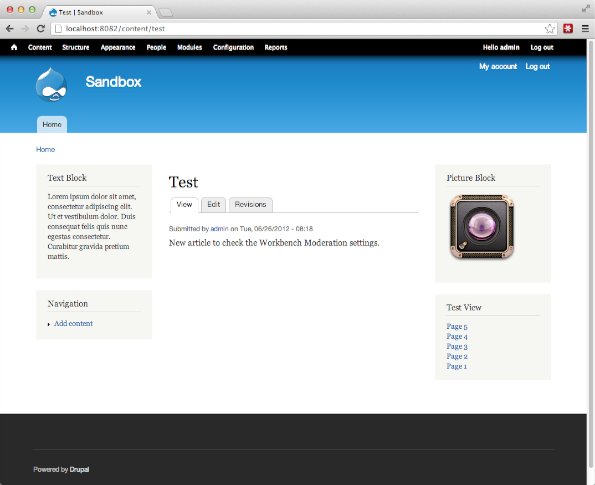
接着需要添加内容。用一些随意内容创建6个node,创建一个view,生成一个列出5个node列表的区块。然后创建若干个自定义的区块,一个是文字,一个是图片,使用不同的输入格式。使用自带的Bartik主题,将文字区块与主导航菜单放在主边栏,图片区块与自定义的View区块放在次边栏。
 然后我完全禁用区块,使用Panels来完成相同的事情。在Page Manager中使能node_view panel,编辑、选择一个三列布局,在左侧添加导航菜单,右侧添加View,中间放置node相关的元素。创建两个自定义区块,设置为“自定义的Panels panes”,并且标记为可重用。
 结果
现在进行测试!关闭所有的核心缓存,使用默认配置,没有使用基于时间的Panels缓存,或者其他乱七八糟的东西。使用Apache自带的ab基准测试程序,我们先访问100次进行预热,然后访问Panels:
Server Software: Apache/2.2.21
Server Hostname: localhost
Server Port: 8082
Document Path: /content/test
Document Length: 5632 bytes
Concurrency Level: 1
Time taken for tests: 3.220 seconds
Complete requests: 100
Failed requests: 0
Write errors: 0
Non-2xx responses: 100
Total transferred: 608500 bytes
HTML transferred: 563200 bytes
Requests per second: 31.05 [#/sec] (mean)
Time per request: 32.203 [ms] (mean)
Time per request: 32.203 [ms] (mean, across all concurrent requests)
Transfer rate: 184.53 [Kbytes/sec] received
Connection Times (ms)
min mean[+/-sd] median max
Connect: 9 26 10.4 31 46
Processing: 0 7 9.9 0 24
Waiting: 0 7 9.9 0 24
Total: 29 32 2.6 32 46
Percentage of the requests served within a certain time (ms)
50% 32
66% 32
75% 32
80% 33
90% 34
95% 35
98% 44
99% 46
100% 46 (longest request)
然后我们停用Panels相关的模块,再次启用Block:
Document Path: /content/test
Document Length: 9411 bytes
Concurrency Level: 1
Time taken for tests: 6.825 seconds
Complete requests: 100
Failed requests: 0
Write errors: 0
Non-2xx responses: 100
Total transferred: 984200 bytes
HTML transferred: 941100 bytes
Requests per second: 14.65 [#/sec] (mean)
Time per request: 68.250 [ms] (mean)
Time per request: 68.250 [ms] (mean, across all concurrent requests)
Transfer rate: 140.83 [Kbytes/sec] received
Connection Times (ms)
min mean[+/-sd] median max
Connect: 65 68 3.5 68 89
Processing: 0 0 0.0 0 0
Waiting: 0 0 0.0 0 0
Total: 65 68 3.5 68 89
Percentage of the requests served within a certain time (ms)
50% 68
66% 68
75% 69
80% 69
90% 70
95% 79
98% 80
99% 89
100% 89 (longest request)
Wow. 从表面上来看,区块很明显的比Panels慢。
然后,让我们来进行更多的测试(感谢James的建议)。首先,启用Drupal自带的区块缓存:
Connection Times (ms)
min mean[+/-sd] median max
Connect: 64 68 3.7 67 87
Processing: 0 0 0.0 0 0
Waiting: 0 0 0.0 0 0
Total: 64 68 3.7 67 87
Percentage of the requests served within a certain time (ms)
50% 67
66% 68
75% 68
80% 68
90% 70
95% 76
98% 82
99% 87
100% 87 (longest request)
很难看出有什么区别!那么我们把所有区块隐藏掉看看会有什么变化。经过一系列的编辑,区块终于不会在我们的测试页面上显示,但还是存在于区域中的:
Connection Times (ms)
min mean[+/-sd] median max
Connect: 9 30 11.6 35 45
Processing: 0 7 11.8 0 32
Waiting: 0 7 11.8 0 32
Total: 34 37 2.3 37 45
Percentage of the requests served within a certain time (ms)
50% 37
66% 38
75% 38
80% 39
90% 40
95% 41
98% 44
99% 45
100% 45 (longest request)
OK,现在貌似好很多了。但当然,我们什么也没做出来!那么这说明了什么?那就是使用区块与Node的页面比没有使用区块而是用Panels来渲染的页面更“笨重”。
Document Path: /content/test
Document Length: 7322 bytes
我们从新将区块放到页面上,但这次没有放回View生成的区块:
Connection Times (ms)
min mean[+/-sd] median max
Connect: 37 40 2.7 40 51
Processing: 0 0 0.0 0 0
Waiting: 0 0 0.0 0 0
Total: 37 40 2.7 40 51
Percentage of the requests served within a certain time (ms)
50% 40
66% 40
75% 41
80% 41
90% 43
95% 48
98% 50
99% 51
100% 51 (longest request)
这是...?这实际上并不坏,那意味着...噢!Views+区块组合起来会让性能变得难看。于是我启用了Views的基于时间的缓存,看看会不会有效果。这样做大概快了6ms,但是没有很大的区别(对区块或者Panels)。
总结
总体来说,Panels比区块快20%左右。但是如果你增加了一些Views区块,那么就不得了了(我们还没分析过是什么原因),Views对性能的极度拖慢只会影响到Block,而Panels则不会受到影响。因此突然间Panels会比区块快100%,这是发生在你使用传统的区块系统来输出Views的内容。但是无论如何,从我们的测试结果来看,Panels都是显而易见地比区块要快。如果能够找出为什么Views会让区块变得如此慢,这将是一个有趣的练习。回到开头的问题:Panels比区块更慢吗?
不是,是更快!
另一个经常会受到的指责是Panels生成的标签太重量。然而有趣的是在使用Bartik主题时,区块与Node生成的页面比只用Panels生成的页面更重。当然,我们没有仔细的研究这个,但的确是一个有趣的发现。
关于区块的更多探讨
当系统需要大量区块的时候,会带来另一个问题。不要忘记,区块系统已经存在于Drupal中很长一段时间,并且没怎么改过。这在一个简单应用中是没问题的,但下面的例子可以说明在你尝试大量使用区块的时候会带来各种问题:我们有一位客户的网站需要几百个区块放在次边栏,每个区块有不同的展示规则。我们发现拖动区块的界面运行的不是很正常(这个问题很难发现)。区块的权重是有限制的(如果没记错的话大概是400),当您在管理界面上拖动区块,一段时间后你会发现他们要不就是全在权重的顶部,要不就是全在底部。结果呢?无论你怎么拖动,它们都会拥有相同的权重,并且按随机的排序显示。一个快速解决的方式是禁用Javascript,使用旧的下拉菜单,手工设定每个区块的合理权重。我可以向您保证,这是一件苦差事!
我的观点是:区块能够实现需求,并且还不赖,但是现在有新的技术可以运行的更快更好。不单单是区块,一般而言,您需要花时间去好好的去检查您的需求,在做出选择之前需要细心的测试您的假定。核心模块不一定是解决您那个特定问题的最佳选择。
一个附加的后续测试
前天晚上,我突然从床上蹦起来(实际情况可能不是这样,但意思是表达出来了),在我的旧HP EliteBook 8730w上又做了一次测试,这台机器运行着 Fedora 14, Apache with mod_php, APC and MySQL,其中大部分都是通过RedHat库安装的,而不是Acquia Dev Desktop,Acquia Dev Desktop只安装在我的Macbook上,因为我很懒而Acquia Dev Desktop很容易安装使用。
结果如下:
Panels:
Connection Times (ms)
min mean[+/-sd] median max
Connect: 0 0 0.0 0 0
Processing: 105 106 1.3 106 112
Waiting: 100 102 1.3 101 107
Total: 105 106 1.3 106 112
Percentage of the requests served within a certain time (ms)
50% 106
66% 106
75% 107
80% 107
90% 108
95% 109
98% 112
99% 112
100% 112 (longest request)
Block:
Connection Times (ms)
min mean[+/-sd] median max
Connect: 0 0 0.0 0 0
Processing: 85 90 9.0 86 132
Waiting: 81 85 7.9 82 127
Total: 85 90 9.0 86 132
Percentage of the requests served within a certain time (ms)
50% 86
66% 88
75% 91
80% 91
90% 99
95% 115
98% 128
99% 132
100% 132 (longest request)
Block without Views:
Connection Times (ms)
min mean[+/-sd] median max
Connect: 0 0 0.0 0 0
Processing: 49 50 1.2 50 56
Waiting: 47 48 1.1 48 53
Total: 49 50 1.2 50 56
Percentage of the requests served within a certain time (ms)
50% 50
66% 50
75% 50
80% 50
90% 52
95% 53
98% 53
99% 56
100% 56 (longest request)
Panels with Simplecache on the View:
Connection Times (ms)
min mean[+/-sd] median max
Connect: 0 0 0.0 0 0
Processing: 70 72 1.1 72 77
Waiting: 67 69 1.1 69 74
Total: 70 72 1.1 72 77
Percentage of the requests served within a certain time (ms)
50% 72
66% 72
75% 72
80% 72
90% 73
95% 74
98% 76
99% 77
100% 77 (longest request)
Panels without Views:
Connection Times (ms)
min mean[+/-sd] median max
Connect: 0 0 0.0 0 0
Processing: 68 70 1.4 70 76
Waiting: 65 67 1.4 67 73
Total: 68 70 1.4 70 76
Percentage of the requests served within a certain time (ms)
50% 70
66% 70
75% 70
80% 70
90% 73
95% 73
98% 73
99% 76
100% 76 (longest request)
我们从上面的结果可以看出什么?首先,Drupal在不同的系统上表现得可以很不同。HP机比MBP更旧并且更慢,而且运行的软件版本更旧。数据库也有些区别(实际上可能HP上的更简单),这也可以让结果发生偏差,虽然我并不认为偏差会很大。
HP的测试结果可以看出,总体而言,如果您使用Views来扩展你的网站,需要考虑得更多。Panels是否会有优势,看起来跟您使用的硬件、软件、以及配置很有关系。它在不同的配置上表现得区别很大。HP的测试也说明了用Panels来显示Views的性能会更好,从加载时间的百分比来看,也说明如果你的区块不使用Views,性能将得到大的提升。
然而,使用HP机测试的结果显示,使用区块的页面会比使用Panels的页面快10%,这个结果跟使用Macbook Pro得出的结果完全相反,Macbook Pro的测试显示Panels比区块要快很多。出现这个情况的原因需要更多的调查。如果其他人希望在其他Macbook Pro上重新进行测试,我会非常希望看到他的测试结果。
最后,我进行的一个附加测试,将Panels中View pane的Simplecache启用,这带来了很大的性能提升。看来Simplecache才是大赢家,这一点也不意外,特别是当页面上有大量Views需要处理时。当使用Simplecache后,使用Panels生成的页面,有没有Views对性能的影响很少,在这种情况下无论在哪个环境上都比优于区块。
结果
现在进行测试!关闭所有的核心缓存,使用默认配置,没有使用基于时间的Panels缓存,或者其他乱七八糟的东西。使用Apache自带的ab基准测试程序,我们先访问100次进行预热,然后访问Panels:
Server Software: Apache/2.2.21
Server Hostname: localhost
Server Port: 8082
Document Path: /content/test
Document Length: 5632 bytes
Concurrency Level: 1
Time taken for tests: 3.220 seconds
Complete requests: 100
Failed requests: 0
Write errors: 0
Non-2xx responses: 100
Total transferred: 608500 bytes
HTML transferred: 563200 bytes
Requests per second: 31.05 [#/sec] (mean)
Time per request: 32.203 [ms] (mean)
Time per request: 32.203 [ms] (mean, across all concurrent requests)
Transfer rate: 184.53 [Kbytes/sec] received
Connection Times (ms)
min mean[+/-sd] median max
Connect: 9 26 10.4 31 46
Processing: 0 7 9.9 0 24
Waiting: 0 7 9.9 0 24
Total: 29 32 2.6 32 46
Percentage of the requests served within a certain time (ms)
50% 32
66% 32
75% 32
80% 33
90% 34
95% 35
98% 44
99% 46
100% 46 (longest request)
然后我们停用Panels相关的模块,再次启用Block:
Document Path: /content/test
Document Length: 9411 bytes
Concurrency Level: 1
Time taken for tests: 6.825 seconds
Complete requests: 100
Failed requests: 0
Write errors: 0
Non-2xx responses: 100
Total transferred: 984200 bytes
HTML transferred: 941100 bytes
Requests per second: 14.65 [#/sec] (mean)
Time per request: 68.250 [ms] (mean)
Time per request: 68.250 [ms] (mean, across all concurrent requests)
Transfer rate: 140.83 [Kbytes/sec] received
Connection Times (ms)
min mean[+/-sd] median max
Connect: 65 68 3.5 68 89
Processing: 0 0 0.0 0 0
Waiting: 0 0 0.0 0 0
Total: 65 68 3.5 68 89
Percentage of the requests served within a certain time (ms)
50% 68
66% 68
75% 69
80% 69
90% 70
95% 79
98% 80
99% 89
100% 89 (longest request)
Wow. 从表面上来看,区块很明显的比Panels慢。
然后,让我们来进行更多的测试(感谢James的建议)。首先,启用Drupal自带的区块缓存:
Connection Times (ms)
min mean[+/-sd] median max
Connect: 64 68 3.7 67 87
Processing: 0 0 0.0 0 0
Waiting: 0 0 0.0 0 0
Total: 64 68 3.7 67 87
Percentage of the requests served within a certain time (ms)
50% 67
66% 68
75% 68
80% 68
90% 70
95% 76
98% 82
99% 87
100% 87 (longest request)
很难看出有什么区别!那么我们把所有区块隐藏掉看看会有什么变化。经过一系列的编辑,区块终于不会在我们的测试页面上显示,但还是存在于区域中的:
Connection Times (ms)
min mean[+/-sd] median max
Connect: 9 30 11.6 35 45
Processing: 0 7 11.8 0 32
Waiting: 0 7 11.8 0 32
Total: 34 37 2.3 37 45
Percentage of the requests served within a certain time (ms)
50% 37
66% 38
75% 38
80% 39
90% 40
95% 41
98% 44
99% 45
100% 45 (longest request)
OK,现在貌似好很多了。但当然,我们什么也没做出来!那么这说明了什么?那就是使用区块与Node的页面比没有使用区块而是用Panels来渲染的页面更“笨重”。
Document Path: /content/test
Document Length: 7322 bytes
我们从新将区块放到页面上,但这次没有放回View生成的区块:
Connection Times (ms)
min mean[+/-sd] median max
Connect: 37 40 2.7 40 51
Processing: 0 0 0.0 0 0
Waiting: 0 0 0.0 0 0
Total: 37 40 2.7 40 51
Percentage of the requests served within a certain time (ms)
50% 40
66% 40
75% 41
80% 41
90% 43
95% 48
98% 50
99% 51
100% 51 (longest request)
这是...?这实际上并不坏,那意味着...噢!Views+区块组合起来会让性能变得难看。于是我启用了Views的基于时间的缓存,看看会不会有效果。这样做大概快了6ms,但是没有很大的区别(对区块或者Panels)。
总结
总体来说,Panels比区块快20%左右。但是如果你增加了一些Views区块,那么就不得了了(我们还没分析过是什么原因),Views对性能的极度拖慢只会影响到Block,而Panels则不会受到影响。因此突然间Panels会比区块快100%,这是发生在你使用传统的区块系统来输出Views的内容。但是无论如何,从我们的测试结果来看,Panels都是显而易见地比区块要快。如果能够找出为什么Views会让区块变得如此慢,这将是一个有趣的练习。回到开头的问题:Panels比区块更慢吗?
不是,是更快!
另一个经常会受到的指责是Panels生成的标签太重量。然而有趣的是在使用Bartik主题时,区块与Node生成的页面比只用Panels生成的页面更重。当然,我们没有仔细的研究这个,但的确是一个有趣的发现。
关于区块的更多探讨
当系统需要大量区块的时候,会带来另一个问题。不要忘记,区块系统已经存在于Drupal中很长一段时间,并且没怎么改过。这在一个简单应用中是没问题的,但下面的例子可以说明在你尝试大量使用区块的时候会带来各种问题:我们有一位客户的网站需要几百个区块放在次边栏,每个区块有不同的展示规则。我们发现拖动区块的界面运行的不是很正常(这个问题很难发现)。区块的权重是有限制的(如果没记错的话大概是400),当您在管理界面上拖动区块,一段时间后你会发现他们要不就是全在权重的顶部,要不就是全在底部。结果呢?无论你怎么拖动,它们都会拥有相同的权重,并且按随机的排序显示。一个快速解决的方式是禁用Javascript,使用旧的下拉菜单,手工设定每个区块的合理权重。我可以向您保证,这是一件苦差事!
我的观点是:区块能够实现需求,并且还不赖,但是现在有新的技术可以运行的更快更好。不单单是区块,一般而言,您需要花时间去好好的去检查您的需求,在做出选择之前需要细心的测试您的假定。核心模块不一定是解决您那个特定问题的最佳选择。
一个附加的后续测试
前天晚上,我突然从床上蹦起来(实际情况可能不是这样,但意思是表达出来了),在我的旧HP EliteBook 8730w上又做了一次测试,这台机器运行着 Fedora 14, Apache with mod_php, APC and MySQL,其中大部分都是通过RedHat库安装的,而不是Acquia Dev Desktop,Acquia Dev Desktop只安装在我的Macbook上,因为我很懒而Acquia Dev Desktop很容易安装使用。
结果如下:
Panels:
Connection Times (ms)
min mean[+/-sd] median max
Connect: 0 0 0.0 0 0
Processing: 105 106 1.3 106 112
Waiting: 100 102 1.3 101 107
Total: 105 106 1.3 106 112
Percentage of the requests served within a certain time (ms)
50% 106
66% 106
75% 107
80% 107
90% 108
95% 109
98% 112
99% 112
100% 112 (longest request)
Block:
Connection Times (ms)
min mean[+/-sd] median max
Connect: 0 0 0.0 0 0
Processing: 85 90 9.0 86 132
Waiting: 81 85 7.9 82 127
Total: 85 90 9.0 86 132
Percentage of the requests served within a certain time (ms)
50% 86
66% 88
75% 91
80% 91
90% 99
95% 115
98% 128
99% 132
100% 132 (longest request)
Block without Views:
Connection Times (ms)
min mean[+/-sd] median max
Connect: 0 0 0.0 0 0
Processing: 49 50 1.2 50 56
Waiting: 47 48 1.1 48 53
Total: 49 50 1.2 50 56
Percentage of the requests served within a certain time (ms)
50% 50
66% 50
75% 50
80% 50
90% 52
95% 53
98% 53
99% 56
100% 56 (longest request)
Panels with Simplecache on the View:
Connection Times (ms)
min mean[+/-sd] median max
Connect: 0 0 0.0 0 0
Processing: 70 72 1.1 72 77
Waiting: 67 69 1.1 69 74
Total: 70 72 1.1 72 77
Percentage of the requests served within a certain time (ms)
50% 72
66% 72
75% 72
80% 72
90% 73
95% 74
98% 76
99% 77
100% 77 (longest request)
Panels without Views:
Connection Times (ms)
min mean[+/-sd] median max
Connect: 0 0 0.0 0 0
Processing: 68 70 1.4 70 76
Waiting: 65 67 1.4 67 73
Total: 68 70 1.4 70 76
Percentage of the requests served within a certain time (ms)
50% 70
66% 70
75% 70
80% 70
90% 73
95% 73
98% 73
99% 76
100% 76 (longest request)
我们从上面的结果可以看出什么?首先,Drupal在不同的系统上表现得可以很不同。HP机比MBP更旧并且更慢,而且运行的软件版本更旧。数据库也有些区别(实际上可能HP上的更简单),这也可以让结果发生偏差,虽然我并不认为偏差会很大。
HP的测试结果可以看出,总体而言,如果您使用Views来扩展你的网站,需要考虑得更多。Panels是否会有优势,看起来跟您使用的硬件、软件、以及配置很有关系。它在不同的配置上表现得区别很大。HP的测试也说明了用Panels来显示Views的性能会更好,从加载时间的百分比来看,也说明如果你的区块不使用Views,性能将得到大的提升。
然而,使用HP机测试的结果显示,使用区块的页面会比使用Panels的页面快10%,这个结果跟使用Macbook Pro得出的结果完全相反,Macbook Pro的测试显示Panels比区块要快很多。出现这个情况的原因需要更多的调查。如果其他人希望在其他Macbook Pro上重新进行测试,我会非常希望看到他的测试结果。
最后,我进行的一个附加测试,将Panels中View pane的Simplecache启用,这带来了很大的性能提升。看来Simplecache才是大赢家,这一点也不意外,特别是当页面上有大量Views需要处理时。当使用Simplecache后,使用Panels生成的页面,有没有Views对性能的影响很少,在这种情况下无论在哪个环境上都比优于区块。
然后我完全禁用区块,使用Panels来完成相同的事情。在Page Manager中使能node_view panel,编辑、选择一个三列布局,在左侧添加导航菜单,右侧添加View,中间放置node相关的元素。创建两个自定义区块,设置为“自定义的Panels panes”,并且标记为可重用。
结果
现在进行测试!关闭所有的核心缓存,使用默认配置,没有使用基于时间的Panels缓存,或者其他乱七八糟的东西。使用Apache自带的ab基准测试程序,我们先访问100次进行预热,然后访问Panels:
Server Software: Apache/2.2.21
Server Hostname: localhost
Server Port: 8082
Document Path: /content/test
Document Length: 5632 bytes
Concurrency Level: 1
Time taken for tests: 3.220 seconds
Complete requests: 100
Failed requests: 0
Write errors: 0
Non-2xx responses: 100
Total transferred: 608500 bytes
HTML transferred: 563200 bytes
Requests per second: 31.05 [#/sec] (mean)
Time per request: 32.203 [ms] (mean)
Time per request: 32.203 [ms] (mean, across all concurrent requests)
Transfer rate: 184.53 [Kbytes/sec] received
Connection Times (ms)
min mean[+/-sd] median max
Connect: 9 26 10.4 31 46
Processing: 0 7 9.9 0 24
Waiting: 0 7 9.9 0 24
Total: 29 32 2.6 32 46
Percentage of the requests served within a certain time (ms)
50% 32
66% 32
75% 32
80% 33
90% 34
95% 35
98% 44
99% 46
100% 46 (longest request)
然后我们停用Panels相关的模块,再次启用Block:
Document Path: /content/test
Document Length: 9411 bytes
Concurrency Level: 1
Time taken for tests: 6.825 seconds
Complete requests: 100
Failed requests: 0
Write errors: 0
Non-2xx responses: 100
Total transferred: 984200 bytes
HTML transferred: 941100 bytes
Requests per second: 14.65 [#/sec] (mean)
Time per request: 68.250 [ms] (mean)
Time per request: 68.250 [ms] (mean, across all concurrent requests)
Transfer rate: 140.83 [Kbytes/sec] received
Connection Times (ms)
min mean[+/-sd] median max
Connect: 65 68 3.5 68 89
Processing: 0 0 0.0 0 0
Waiting: 0 0 0.0 0 0
Total: 65 68 3.5 68 89
Percentage of the requests served within a certain time (ms)
50% 68
66% 68
75% 69
80% 69
90% 70
95% 79
98% 80
99% 89
100% 89 (longest request)
Wow. 从表面上来看,区块很明显的比Panels慢。
然后,让我们来进行更多的测试(感谢James的建议)。首先,启用Drupal自带的区块缓存:
Connection Times (ms)
min mean[+/-sd] median max
Connect: 64 68 3.7 67 87
Processing: 0 0 0.0 0 0
Waiting: 0 0 0.0 0 0
Total: 64 68 3.7 67 87
Percentage of the requests served within a certain time (ms)
50% 67
66% 68
75% 68
80% 68
90% 70
95% 76
98% 82
99% 87
100% 87 (longest request)
很难看出有什么区别!那么我们把所有区块隐藏掉看看会有什么变化。经过一系列的编辑,区块终于不会在我们的测试页面上显示,但还是存在于区域中的:
Connection Times (ms)
min mean[+/-sd] median max
Connect: 9 30 11.6 35 45
Processing: 0 7 11.8 0 32
Waiting: 0 7 11.8 0 32
Total: 34 37 2.3 37 45
Percentage of the requests served within a certain time (ms)
50% 37
66% 38
75% 38
80% 39
90% 40
95% 41
98% 44
99% 45
100% 45 (longest request)
OK,现在貌似好很多了。但当然,我们什么也没做出来!那么这说明了什么?那就是使用区块与Node的页面比没有使用区块而是用Panels来渲染的页面更“笨重”。
Document Path: /content/test
Document Length: 7322 bytes
我们从新将区块放到页面上,但这次没有放回View生成的区块:
Connection Times (ms)
min mean[+/-sd] median max
Connect: 37 40 2.7 40 51
Processing: 0 0 0.0 0 0
Waiting: 0 0 0.0 0 0
Total: 37 40 2.7 40 51
Percentage of the requests served within a certain time (ms)
50% 40
66% 40
75% 41
80% 41
90% 43
95% 48
98% 50
99% 51
100% 51 (longest request)
这是...?这实际上并不坏,那意味着...噢!Views+区块组合起来会让性能变得难看。于是我启用了Views的基于时间的缓存,看看会不会有效果。这样做大概快了6ms,但是没有很大的区别(对区块或者Panels)。
总结
总体来说,Panels比区块快20%左右。但是如果你增加了一些Views区块,那么就不得了了(我们还没分析过是什么原因),Views对性能的极度拖慢只会影响到Block,而Panels则不会受到影响。因此突然间Panels会比区块快100%,这是发生在你使用传统的区块系统来输出Views的内容。但是无论如何,从我们的测试结果来看,Panels都是显而易见地比区块要快。如果能够找出为什么Views会让区块变得如此慢,这将是一个有趣的练习。回到开头的问题:Panels比区块更慢吗?
不是,是更快!
另一个经常会受到的指责是Panels生成的标签太重量。然而有趣的是在使用Bartik主题时,区块与Node生成的页面比只用Panels生成的页面更重。当然,我们没有仔细的研究这个,但的确是一个有趣的发现。
关于区块的更多探讨
当系统需要大量区块的时候,会带来另一个问题。不要忘记,区块系统已经存在于Drupal中很长一段时间,并且没怎么改过。这在一个简单应用中是没问题的,但下面的例子可以说明在你尝试大量使用区块的时候会带来各种问题:我们有一位客户的网站需要几百个区块放在次边栏,每个区块有不同的展示规则。我们发现拖动区块的界面运行的不是很正常(这个问题很难发现)。区块的权重是有限制的(如果没记错的话大概是400),当您在管理界面上拖动区块,一段时间后你会发现他们要不就是全在权重的顶部,要不就是全在底部。结果呢?无论你怎么拖动,它们都会拥有相同的权重,并且按随机的排序显示。一个快速解决的方式是禁用Javascript,使用旧的下拉菜单,手工设定每个区块的合理权重。我可以向您保证,这是一件苦差事!
我的观点是:区块能够实现需求,并且还不赖,但是现在有新的技术可以运行的更快更好。不单单是区块,一般而言,您需要花时间去好好的去检查您的需求,在做出选择之前需要细心的测试您的假定。核心模块不一定是解决您那个特定问题的最佳选择。
一个附加的后续测试
前天晚上,我突然从床上蹦起来(实际情况可能不是这样,但意思是表达出来了),在我的旧HP EliteBook 8730w上又做了一次测试,这台机器运行着 Fedora 14, Apache with mod_php, APC and MySQL,其中大部分都是通过RedHat库安装的,而不是Acquia Dev Desktop,Acquia Dev Desktop只安装在我的Macbook上,因为我很懒而Acquia Dev Desktop很容易安装使用。
结果如下:
Panels:
Connection Times (ms)
min mean[+/-sd] median max
Connect: 0 0 0.0 0 0
Processing: 105 106 1.3 106 112
Waiting: 100 102 1.3 101 107
Total: 105 106 1.3 106 112
Percentage of the requests served within a certain time (ms)
50% 106
66% 106
75% 107
80% 107
90% 108
95% 109
98% 112
99% 112
100% 112 (longest request)
Block:
Connection Times (ms)
min mean[+/-sd] median max
Connect: 0 0 0.0 0 0
Processing: 85 90 9.0 86 132
Waiting: 81 85 7.9 82 127
Total: 85 90 9.0 86 132
Percentage of the requests served within a certain time (ms)
50% 86
66% 88
75% 91
80% 91
90% 99
95% 115
98% 128
99% 132
100% 132 (longest request)
Block without Views:
Connection Times (ms)
min mean[+/-sd] median max
Connect: 0 0 0.0 0 0
Processing: 49 50 1.2 50 56
Waiting: 47 48 1.1 48 53
Total: 49 50 1.2 50 56
Percentage of the requests served within a certain time (ms)
50% 50
66% 50
75% 50
80% 50
90% 52
95% 53
98% 53
99% 56
100% 56 (longest request)
Panels with Simplecache on the View:
Connection Times (ms)
min mean[+/-sd] median max
Connect: 0 0 0.0 0 0
Processing: 70 72 1.1 72 77
Waiting: 67 69 1.1 69 74
Total: 70 72 1.1 72 77
Percentage of the requests served within a certain time (ms)
50% 72
66% 72
75% 72
80% 72
90% 73
95% 74
98% 76
99% 77
100% 77 (longest request)
Panels without Views:
Connection Times (ms)
min mean[+/-sd] median max
Connect: 0 0 0.0 0 0
Processing: 68 70 1.4 70 76
Waiting: 65 67 1.4 67 73
Total: 68 70 1.4 70 76
Percentage of the requests served within a certain time (ms)
50% 70
66% 70
75% 70
80% 70
90% 73
95% 73
98% 73
99% 76
100% 76 (longest request)
我们从上面的结果可以看出什么?首先,Drupal在不同的系统上表现得可以很不同。HP机比MBP更旧并且更慢,而且运行的软件版本更旧。数据库也有些区别(实际上可能HP上的更简单),这也可以让结果发生偏差,虽然我并不认为偏差会很大。
HP的测试结果可以看出,总体而言,如果您使用Views来扩展你的网站,需要考虑得更多。Panels是否会有优势,看起来跟您使用的硬件、软件、以及配置很有关系。它在不同的配置上表现得区别很大。HP的测试也说明了用Panels来显示Views的性能会更好,从加载时间的百分比来看,也说明如果你的区块不使用Views,性能将得到大的提升。
然而,使用HP机测试的结果显示,使用区块的页面会比使用Panels的页面快10%,这个结果跟使用Macbook Pro得出的结果完全相反,Macbook Pro的测试显示Panels比区块要快很多。出现这个情况的原因需要更多的调查。如果其他人希望在其他Macbook Pro上重新进行测试,我会非常希望看到他的测试结果。
最后,我进行的一个附加测试,将Panels中View pane的Simplecache启用,这带来了很大的性能提升。看来Simplecache才是大赢家,这一点也不意外,特别是当页面上有大量Views需要处理时。当使用Simplecache后,使用Panels生成的页面,有没有Views对性能的影响很少,在这种情况下无论在哪个环境上都比优于区块。Drupal 版本
nice